Since this year, Microsoft has put forward several new possibilities to add telemetry to all services. The first major change was the new functionality of Monitor, which has been released initially only for Canvas Apps and then also for Models Driven Apps and results in a screen displaying in real time all events performed from a user’s session in order to diagnose a problem. There was also the integration of Application Insight with the Canvas App to send custom traces.
Before all of this, we were mainly using Dataverse’s internal traces that we could manage via the ITracingService, but we often had to manually set up an integration with an external monitoring tool allowing us to easily centralize all logs but also to have a view on performance and adoption (page views, load time etc…).
Recently, Microsoft has taken this aspect a step further by announcing a standard integration with Application Insight.
Why monitoring is important for your environnement?
Before looking more deeply into what this new functionality brings, I think it is important to take a step back and consider the purpose of implementing monitoring!
Monitoring the integrity of a service has always been a key issue and is directly related to technical design, especially when there is not necessarily a suitable tool available. It has grown considerably with the democratization of cloud computing and SaaS services such as Dynamics 365/Dataverse. Companies have more and more applications (thanks to Power Apps :p ) without necessarily fully mastering their technologies or development, and this often results in scattered or ad hoc logs, which leads to a fragmented view of an environment or of a complete information system.
In the case of a Dataverse environment and the use of a Model Driven App, these elements seem rather obscure if you encounter an error. If you have not implemented a monitoring system yourself, you may need to contact the technical Microsoft support to find out what is going on and whether it is a platform limitation due to a load increase, massive use of the application by users around the world, development with external dependencies impacting performance etc. Even though we, as a power platform specialist, can provide an initial analysis, it can be difficult to get an overall view or to follow a user path/session. Furthermore, as we customize the system through server-side and client-side developments, it is very interesting and important to monitor how these will impact performance and thus optimize or even think about another more coherent design. Another point is to be able to position ourselves proactively on the management of incidents by integrating alerts, for example for a call to an external service that would exceed a certain response time. If we see that the response time has increased or become risky, we can act accordingly before a problem occurs.
What is included in this telemetry?
Application Insight basics
If you are not familiar with Application insight, I recommend that you learn some stuff about it because it can be quite tricky at first if you want to search for what you are interested in! Application Insight is a part of Azure Monitor or rather a feature and is widely used for diagnostics and monitoring. Data is collected and stored in Azure Monitor logs via Application Insight. It also implements a standardized model in order to provide application/service/language agnostic monitoring.
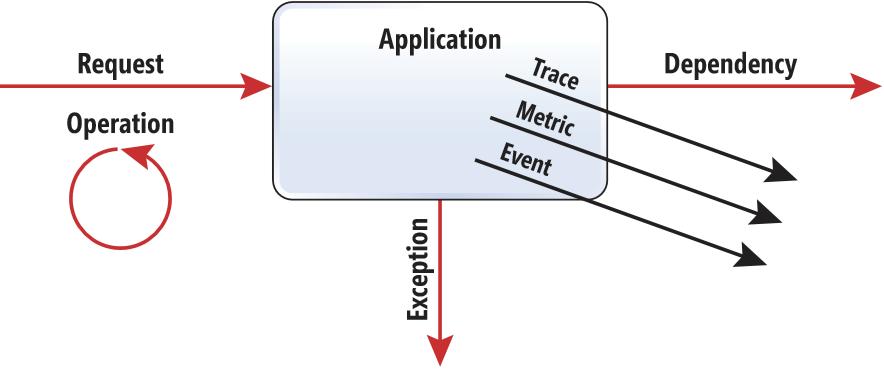
Three types of data are automatically collected:
- Request: Data collected to record a request when your application/environment receives a request. For example, all HTTP requests will be tracked, even if they come from the UCI or SDK.
- Exception: Usually represents an exception that causes an operation to fail.
- Dependency: Represents a call from your application to an external service. For example, if you interface with an external system.
You will also notice that other additional elements are available to allow us to send personalized information (which we will not discuss in this blog post ):
- Trace: Used to send custom traces.
- Event: Used to log user interaction with the aim of analyzing the path taken.
- Metric: Used to log specific measures and then generate reports.
What about Dataverse analytics data?
By using this new feature, a certain amount of information will be available without needing to set up additional traces, so it is interesting to understand the scope of this OOB telemetry!
As mentioned above, it is not only the errors that could occur but also all the request performed on the server and the interface interaction, whether it is an API request, a request to an external service, the loading of a form (currently saving a form and the actions generated by the use of the command bar are not yet available) or the loading of a dashboard!
For each of the available types, the tables that store the data are not the same and therefore their attributes are not the same either (which will be very useful if you want to make special requests for alerts or dashboards).
Here is an extract from the Microsoft documentation that shows exactly which table we should look at depending on the type we want to monitor:
| Telemetry type | Application insight table name |
|---|---|
| Unified Interface page loads | pageViews |
| Unified Interface outbound network requests | Dependency |
| Dataverse API incoming calls | Request |
| Plug-in executions | Dependency |
| SDK executions (Retrieve, RetrieveMultiple, FetchXML transformation, and so on) | Dependency |
| Exceptions during the execution of plug-in and SDK calls | Exceptions |
You can find the list of attributes directly in the Microsoft documentation or simply by browsing Application Insight, but all the tables have a certain amount of information in common, which allows you, for example, to:
- Track an end-to-end operation
- Track a particular session execution
- Track a specific user
- Have an overview focused on client type used
Note that you will not get any information about the infrastructure itself, as this is a SaaS deployment and therefore application-oriented traces (you will not have any trace of the storage of your instance 😉 ).
Setting up your environment to export telemetry to Application Insight
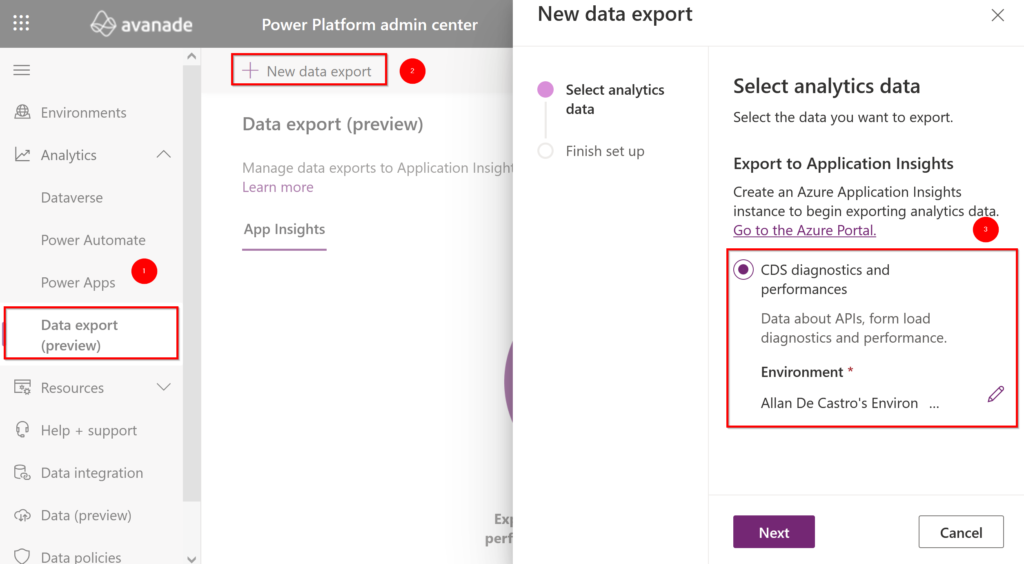
First, you must have an Application Insight on the same tenant as your environment and then go to the Power Platform Administration center (PPAC). You should be able to access this export functionality from the Analytics tab (if not, please note that enablement of Application Insights is limited to customers with a paid/premium Dataverse licenses available for the tenant and as it’s still a preview you may need to ask Microsoft for that), click on the New data export button and then select the Export to Application Insight option and ensure that you select the target environment.
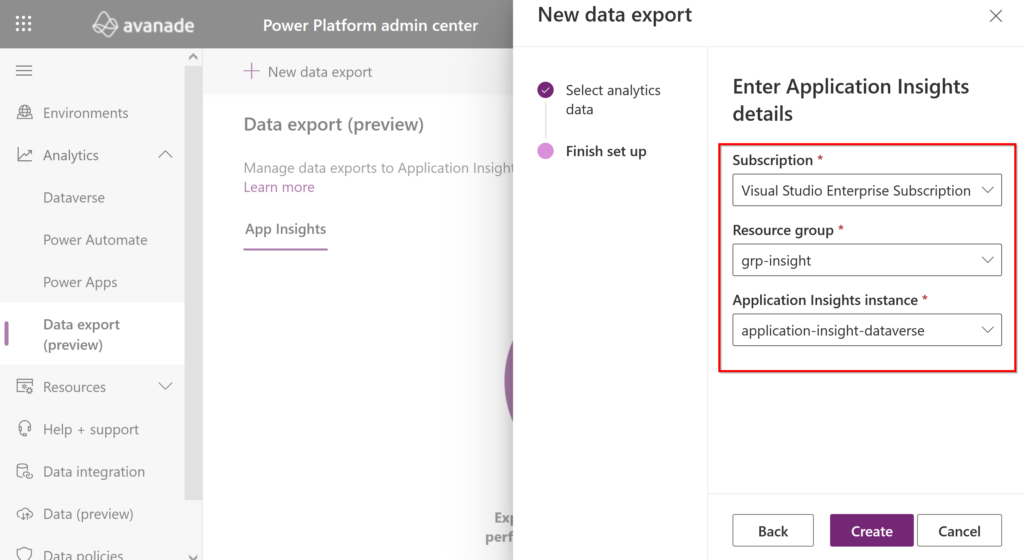
When you are about to select the instance of Application Insight for which you want to integrate your environment and therefore export data, you will need to ensure that you choose a subscription and a resource group associated with it. What is interesting here is that this means that an ISV cannot send traces on an Application Insight instance in its own tenant (unless it is integrating a custom process into its developments) but only on that of the tenant.
Once created, you will see a success notification at the top, and you can start exploring your analytics data!

Analysing OOB analytics data
As soon as the export is set up, you will quickly see that data is already being collected almost instantly!
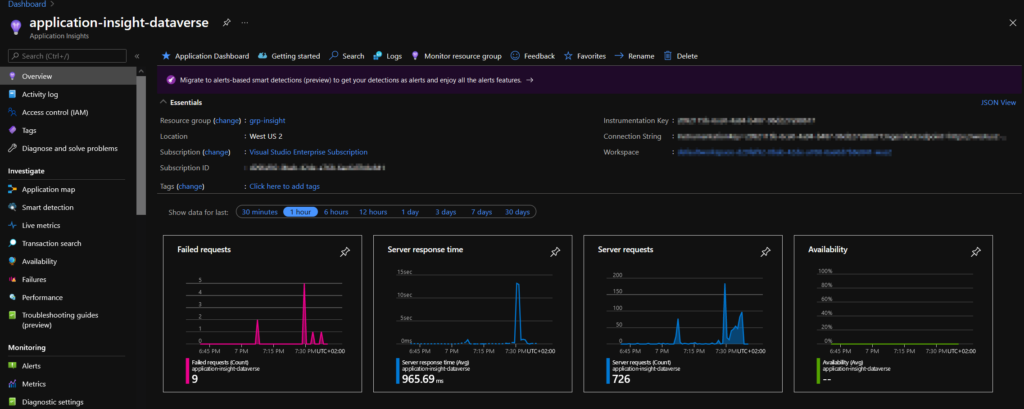
In this first screen, you have a very generalized view based on only four graphs. The best way to refine it is to look at the following three elements: Transaction Search, Failures and Performance.
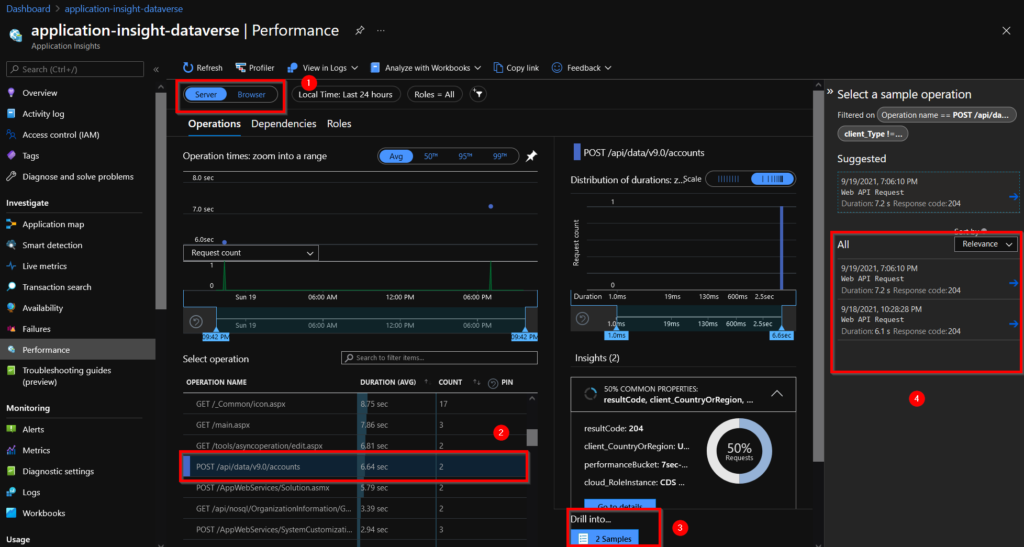
By navigating to the Performance tab, you can discern metrics in relation to how long certain operations take to complete. By selecting Server (1), we have a list of all operations, which you can order by their durations, and we can select a particular operation, as seen here with a POST to the account table (2), and decide to display (3) the examples of the operations that are part of this metric which allows us to explore them in more detail (4).
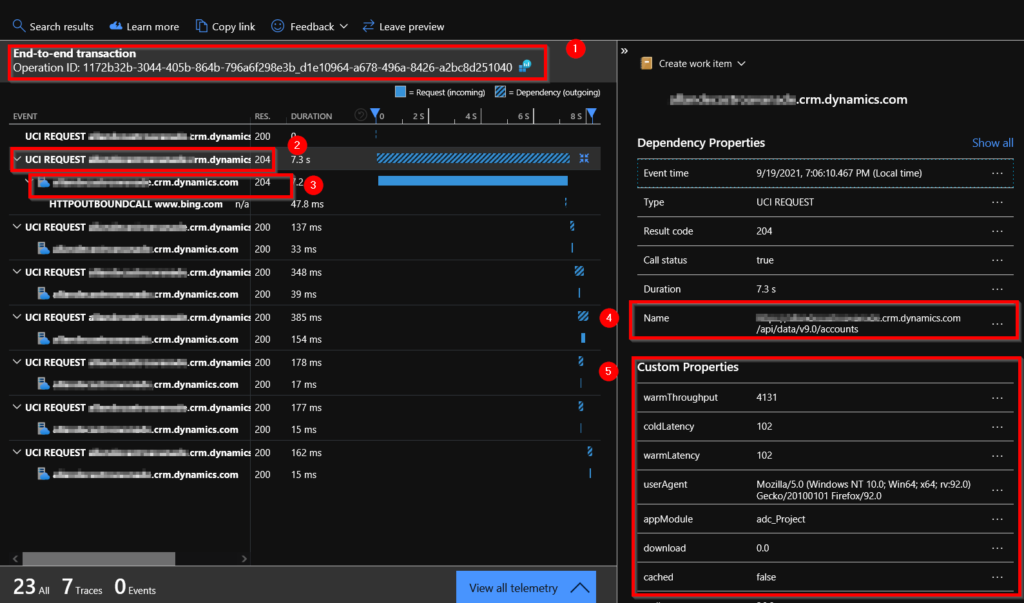
If we open the details of one of the operations, we can see that we have access to the end-to-end transaction thanks to the operation id common field (1). We can see that the unified interface (2) is used to send the creation request (3). We can check the name of the operation, which is the end point of the API for creating an account (4) and finally we have some information about the dependency of the UI (5) (for example, we have the name of the Model Driven app in the appModule field, which could be used as a filter in the case where we have several applications in the same environment).
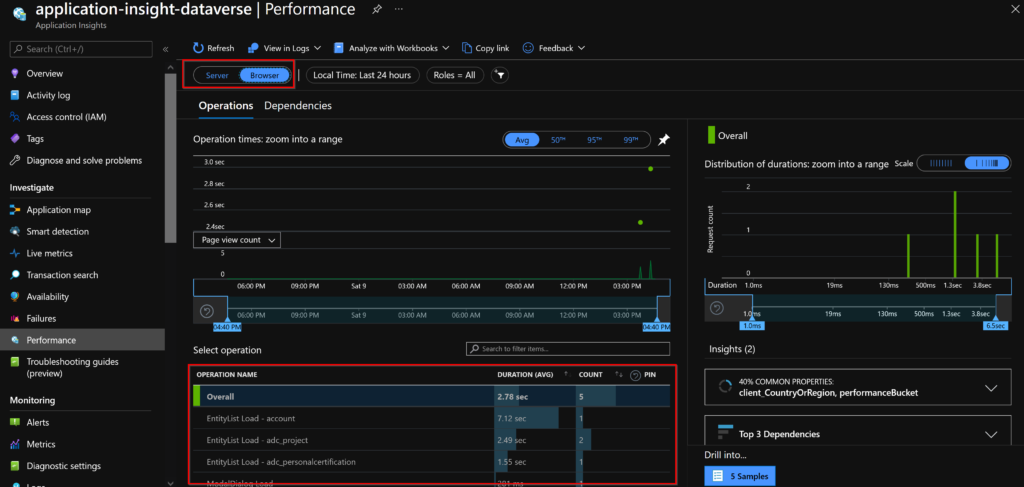
As you have seen, it is also possible to look at client-side operations! It’s quite good news to have this data without having to implement traces, and it allows us to quickly visualize what is happening on a form for example!
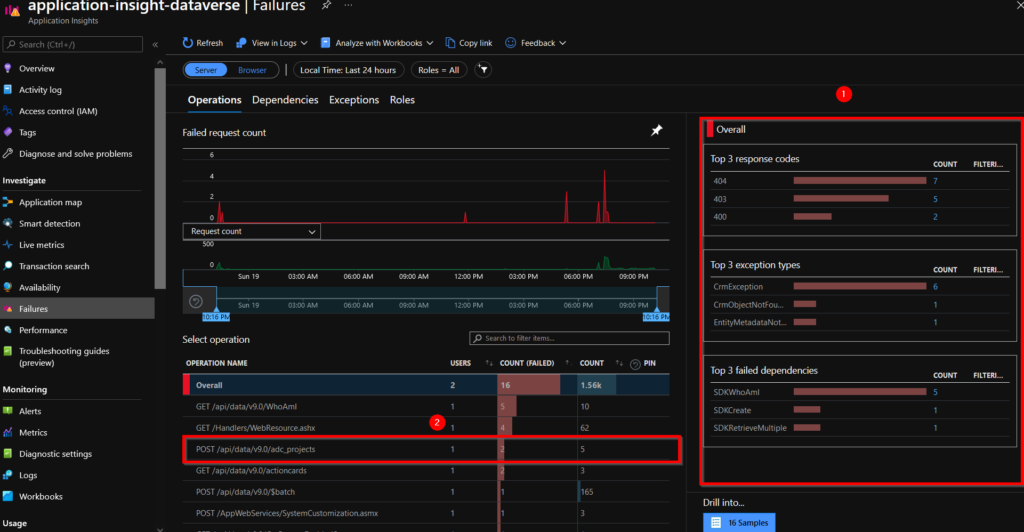
Now let’s take a look at the Failures tab of Application Insight! In parallel, I created a new table “Project” for which I defined an alternate key for only one field and I tried to create two records with the same value, thus generating an error.
As for the Performance tab, we can have a quick overview in the right panel (1) highlighting the main problems based on the error code, type and dependencies. There is a POST operation on the project table which has two errors (2).
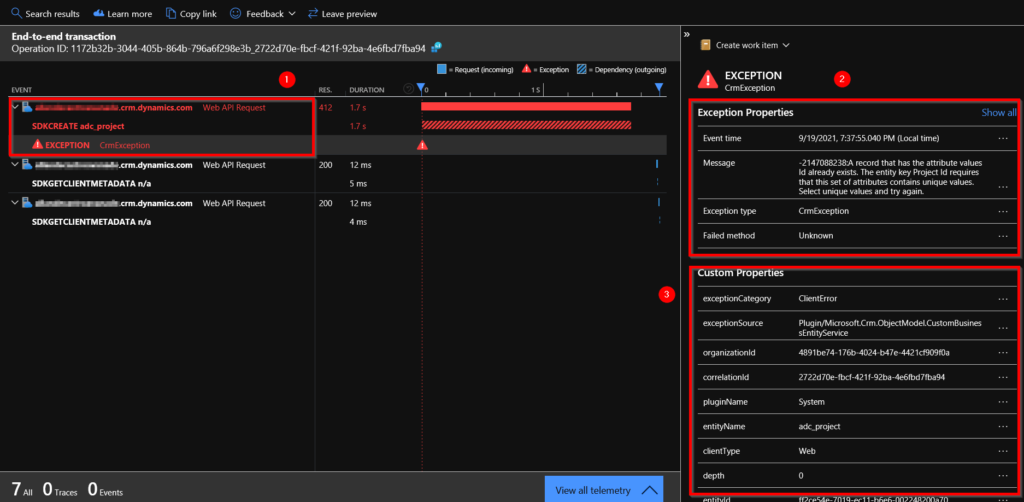
If we take the same approach as previously and go into more detail about this transaction, we can see that there was a creation request on the “Project” table, but it raised an exception (1). By clicking on this exception, we can access the properties of this data, and we can understand that the error is due to the fact that the value entered is not unique for this table (2). In addition, we can also access the custom properties (3).
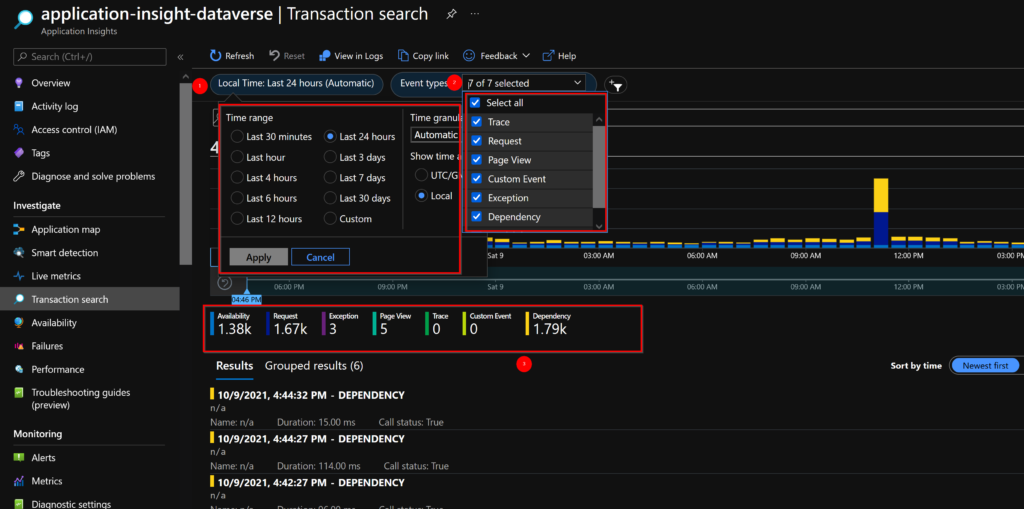
Now let’s look at the Transaction Search tab. This screen will allow us to easily search for elements that have been brought up, regardless of the type of data. If I want to find a particular item, I always start from this search. You can easily use the filter criteria to adjust the time period (1) you want to search for or even the type of event retrieved (2). Depending on the filters applied, you will have an overview of all available events (3).
Another interesting point is that it is possible to filter, by selecting the filter icon (1), on certain properties (2) specific to events, which makes it possible to obtain a certain granularity.
For example, here I decide to display all the elements over the last 24 hours that are linked to the Model Driven App “adc_Project” for which the person executing the action resides in France, uses a web browser and whose operations concern the adc_project or account table:

I hope you enjoyed this blog post and that it showed you how useful this feature is or saved you time 🙂 .
In a future article, I will show how to extend these traces for server-side developments and to create alerts on different criteria.
Leave a Reply