As Solution Architects, we’ve all encountered the question from customers about monitoring the entire platform. While we have various methods to collect data (audit, application insights, system jobs, plugin trace logs, and more), we often find ourselves in a quandary when it comes to storage capacity. In this article, we’ll explore ways to harness these data sources effectively and endeavor to automate the reporting process.
Dataverse Capacity Storage
As you may know, Dataverse storage is divided into three components: Database, File, and Log. The available capacity is primarily determined by the licenses held for a tenant, allowing for storage expansion, and additional add-ons can be purchased to further increase capacity. However, there may be instances where you exceed this allocated space, leading to technical constraints like the inability to use backup for restore operation. Typically, an alert is generated within the message center, notifying you when a certain threshold (non-configurable and by default) is reached. However, this requires regular monitoring of the message center and doesn’t provide a historical trend of storage consumption, limiting your ability to take proactive storage management actions. Currently, monitoring needs to be conducted through the Tenant Capacity Summary Report within the Power Platform Admin Center (PPAC), but it lacks alerting capabilities, and the historical data is only retained for 28 days.
Note that there are now also two other storage facilities linked to Finance & Operation, which you’ll see when you link an FnO environment and also a little further on in this article.
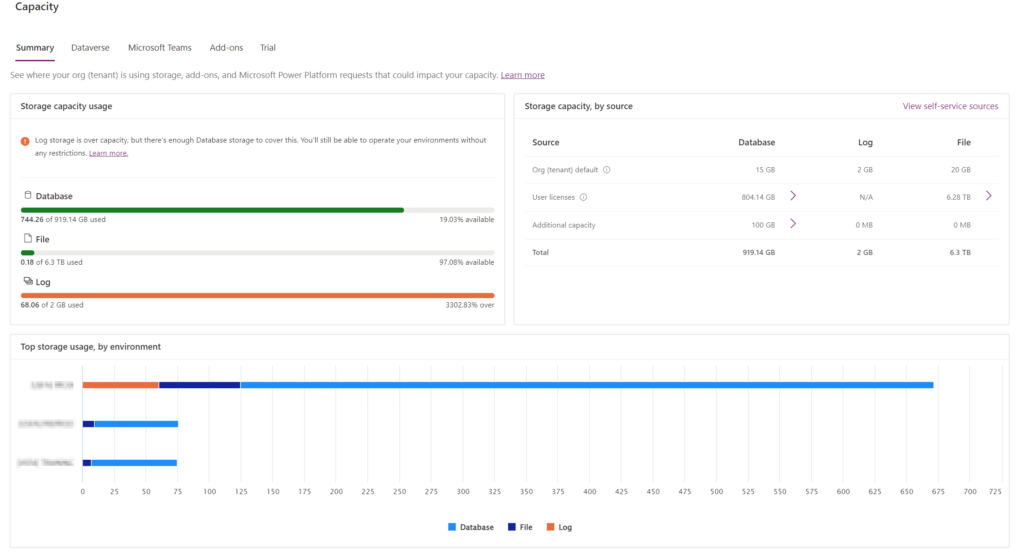
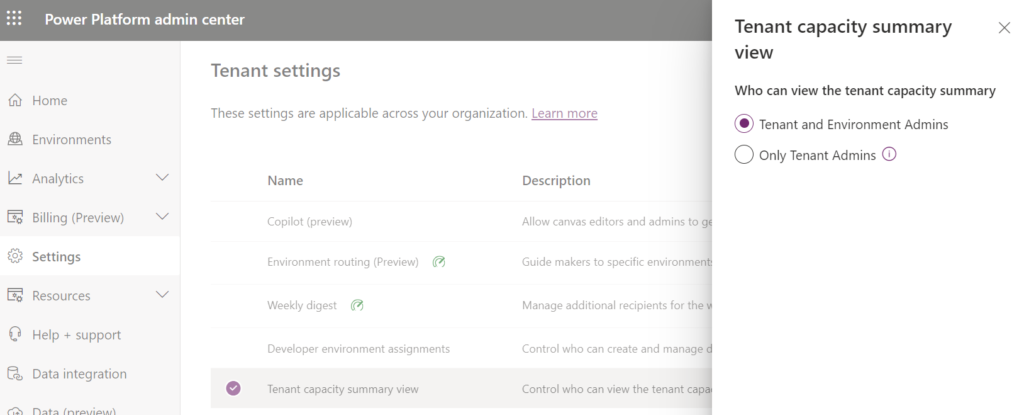
Recently, the “Capacity” tab was no longer available due to a change in tenant settings. You can make this report available to tenant administrators only, or to tenant administrators and environment administrators via PPAC-level settings.
Obtaining visibility across all environments presents a challenge. To achieve this, one must hold roles such as Global Admin, Power Platform Admin, or System Administrator in each environment. However, regardless of these roles, you’ll encounter the following issues:
- Lack of long-term history
- Absence of grouping by environment type or project
- No alerting mechanism in place
- These challenges can impact the effective management and monitoring of Power Platform environments.
Building a Daily Capacity Report
Let’s start by building a Daily Capacity Store that targets all your organization’s environments and can be used either to send to specific people, or to feed a dedicated database to obtain all historical data! To do this, we’re going to rely on Power Automate and Power Platform API (still in preview at the moment, so take care and don’t rely on it as data contracts can change).
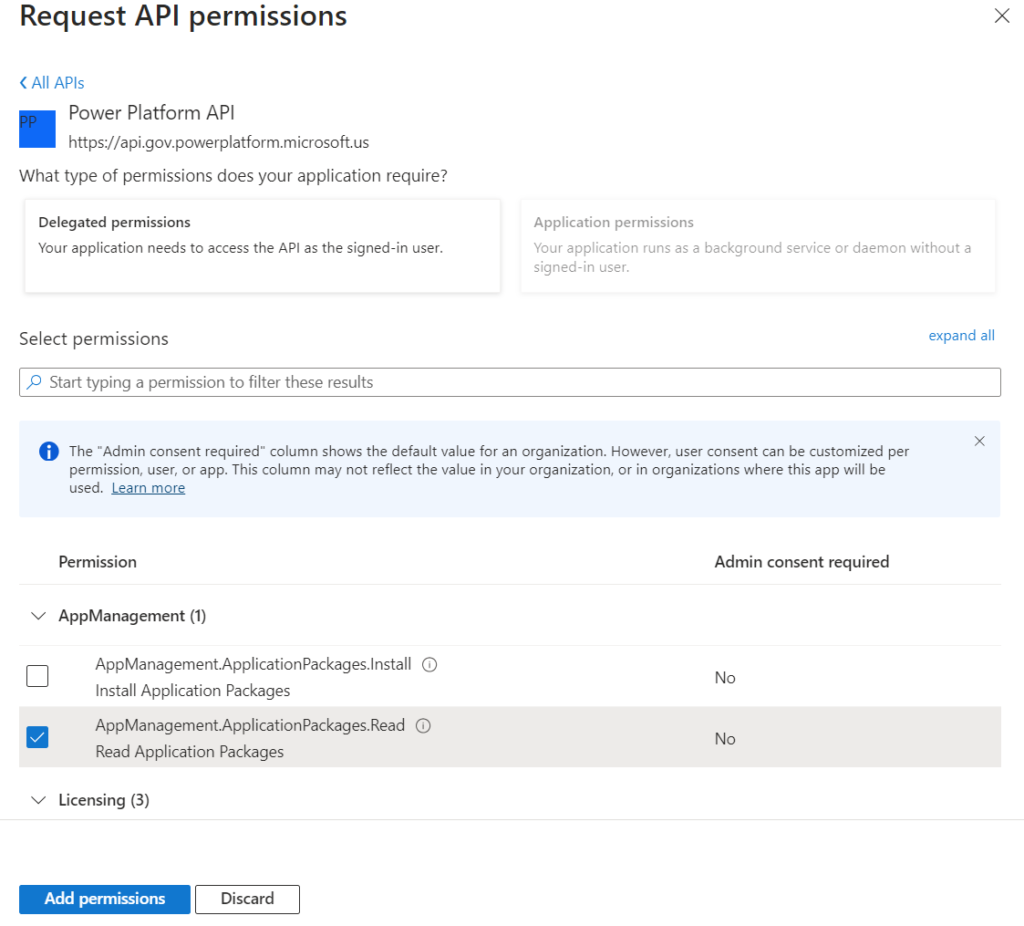
Register an App Registration with Power Platform API Permission
I’m not going to explain how to create an App Registration here, as there are a lot of resources on the subject and it’s not exactly unknown these days, but you can take a look at this link: Register an application via Azure Portal . What’s special here is that you’ll need to give read privilege for this API, but by default this API is not visible, you can confirm this by trying a search like this:
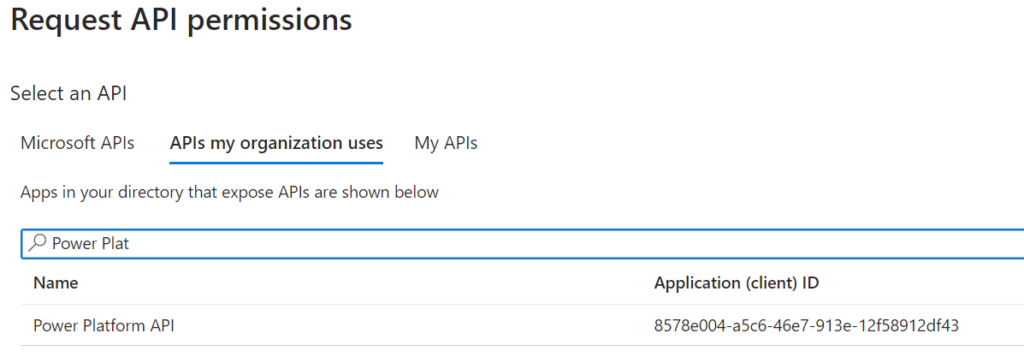
To view/add the Power Platform API, you’ll need to go through a few PowerShell commands:
#Install the Azure AD the module
Install-Module AzureAD

#Import the Module
Import-Module AzureAD

#Connect to the portal with user prompt
Connect-AzureAD

$appId = "8578e004-a5c6-46e7-913e-12f58912df43"
New-AzureADServicePrincipal -AppId $appId -DisplayName "Power Platform API"
Now the only remaining thing is to ensure to add the permission and of course select Grant admin consent to complete the setup.
Then you will have to ensure that your SPN have the same permissions as a tenant admin:
$appId = "YOUR_APP_ID"
$tenantId  = "YOUR_TENANT_ID"

# Login interactively with a tenant administrator for Power Platform
Add-PowerAppsAccount -Endpoint prod -TenantID $tenantId

# Register a new application, this gives the SPN / client application same permissions as a tenant admin
New-PowerAppManagementApp -ApplicationId $appId
Explore Power Platform API
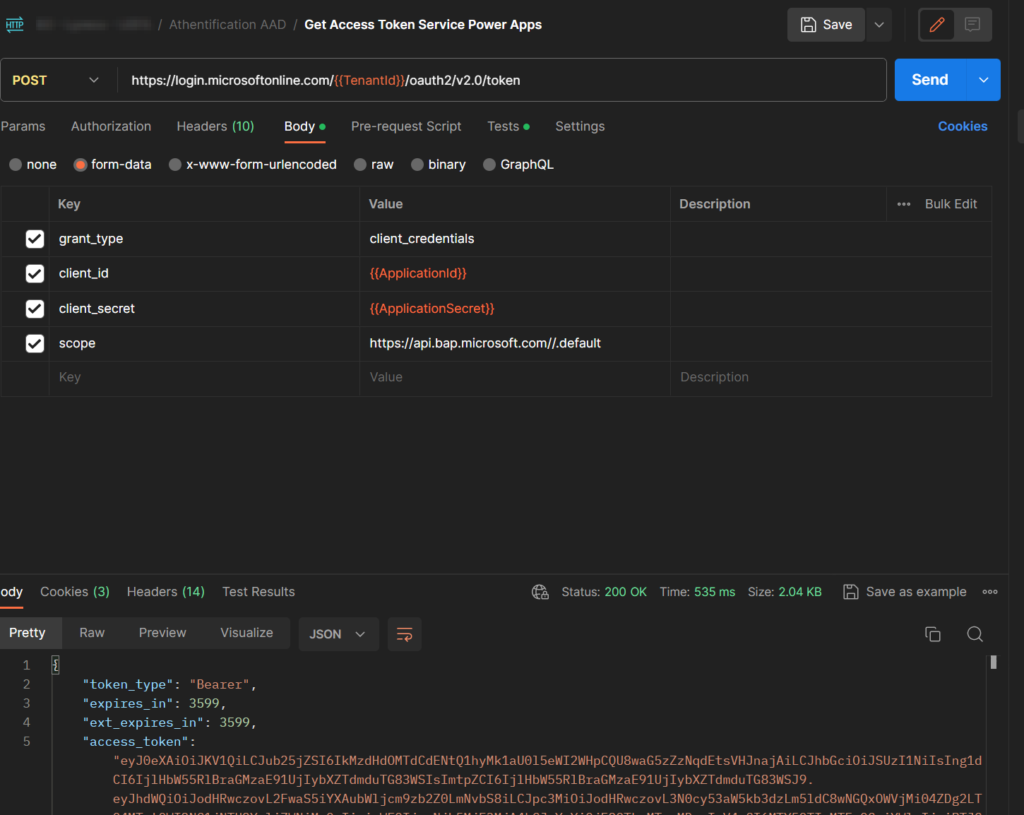
The first thing to do is of course to get the Bearer Token, you can perform a basic POST to ttps://login.microsoftonline.com/{TenantId}/oauth2/v2.0/token using the Client Credentials Flow thanks to the Client Id & Client Secret generated previously and targeting the scope “https://api.bap.microsoft.com//.default”:
There are different endpoints available for other scénarios like managing add-on allocation, billing policy environment and even for Power Pages (restarting a site, creatin ga new site …). but the one we’re interesting about is: https://api.bap.microsoft.com/providers/Microsoft.BusinessAppPlatform/scopes/admin/environments?api-version=2023-06-01
Note that at this moment (remember that this API is still in preview), the supported API Versions are: ‘2016-02-01, 2016-11-01, 2018-01-01, 2018-10-01, 2019-05-01, 2019-10-01, 2020-04-01, 2020-05-01, 2020-06-01, 2020-08-01, 2020-09-01, 2020-10-01, 2021-03-01, 2021-04-01, 2021-07-01, 2022-05-01, 2023-06-01’.
If you’ve managed to get a 2XX status, you’ll see a huge JSON but without any capacity information, so you need to use the word expand regarding properties like this: &$expand=properties.capacity,properties.addons. Now you’ll see a node nested in all environment objects containing something similar like this:
                "capacity": [
                    {
                        "capacityType": "Database",
                        "actualConsumption": 3562.086,
                        "ratedConsumption": 3562.086,
                        "capacityUnit": "MB",
                        "updatedOn": "2023-11-05T04:43:08Z"
                    },
                    {
                        "capacityType": "File",
                        "actualConsumption": 5606.016,
                        "ratedConsumption": 5606.016,
                        "capacityUnit": "MB",
                        "updatedOn": "2023-11-05T04:43:08Z"
                    },
                    {
                        "capacityType": "Log",
                        "actualConsumption": 0.0,
                        "ratedConsumption": 0.0,
                        "capacityUnit": "MB",
                        "updatedOn": "2023-11-05T04:43:08Z"
                    },
                    {
                        "capacityType": "FinOpsDatabase",
                        "actualConsumption": 0.0,
                        "ratedConsumption": 0.0,
                        "capacityUnit": "MB",
                        "updatedOn": "0001-01-01T00:00:00Z"
                    },
                    {
                        "capacityType": "FinOpsFile",
                        "actualConsumption": 0.0,
                        "ratedConsumption": 0.0,
                        "capacityUnit": "MB",
                        "updatedOn": "0001-01-01T00:00:00Z"
                    }
                ]
As you can see, it’s pretty interesting because we now have what we wanted and even more because we also have financial operation capability (I will not use it here as this part is very in preview, in case you made the connection between Dataverse & Finance & Operation). Now let’s automate this to have a final report.
Create a Scheduled Power Automate
Now that we have a little more information about this API for the authentication part, but also about the content returned, we can easily exploit this within a component (here Power Automate to facilitate the work and the demonstration, but this is amply possible with others such as Function App, Power BI, PowerShell, C# etc.) to return this information to the right people on a regular basis.
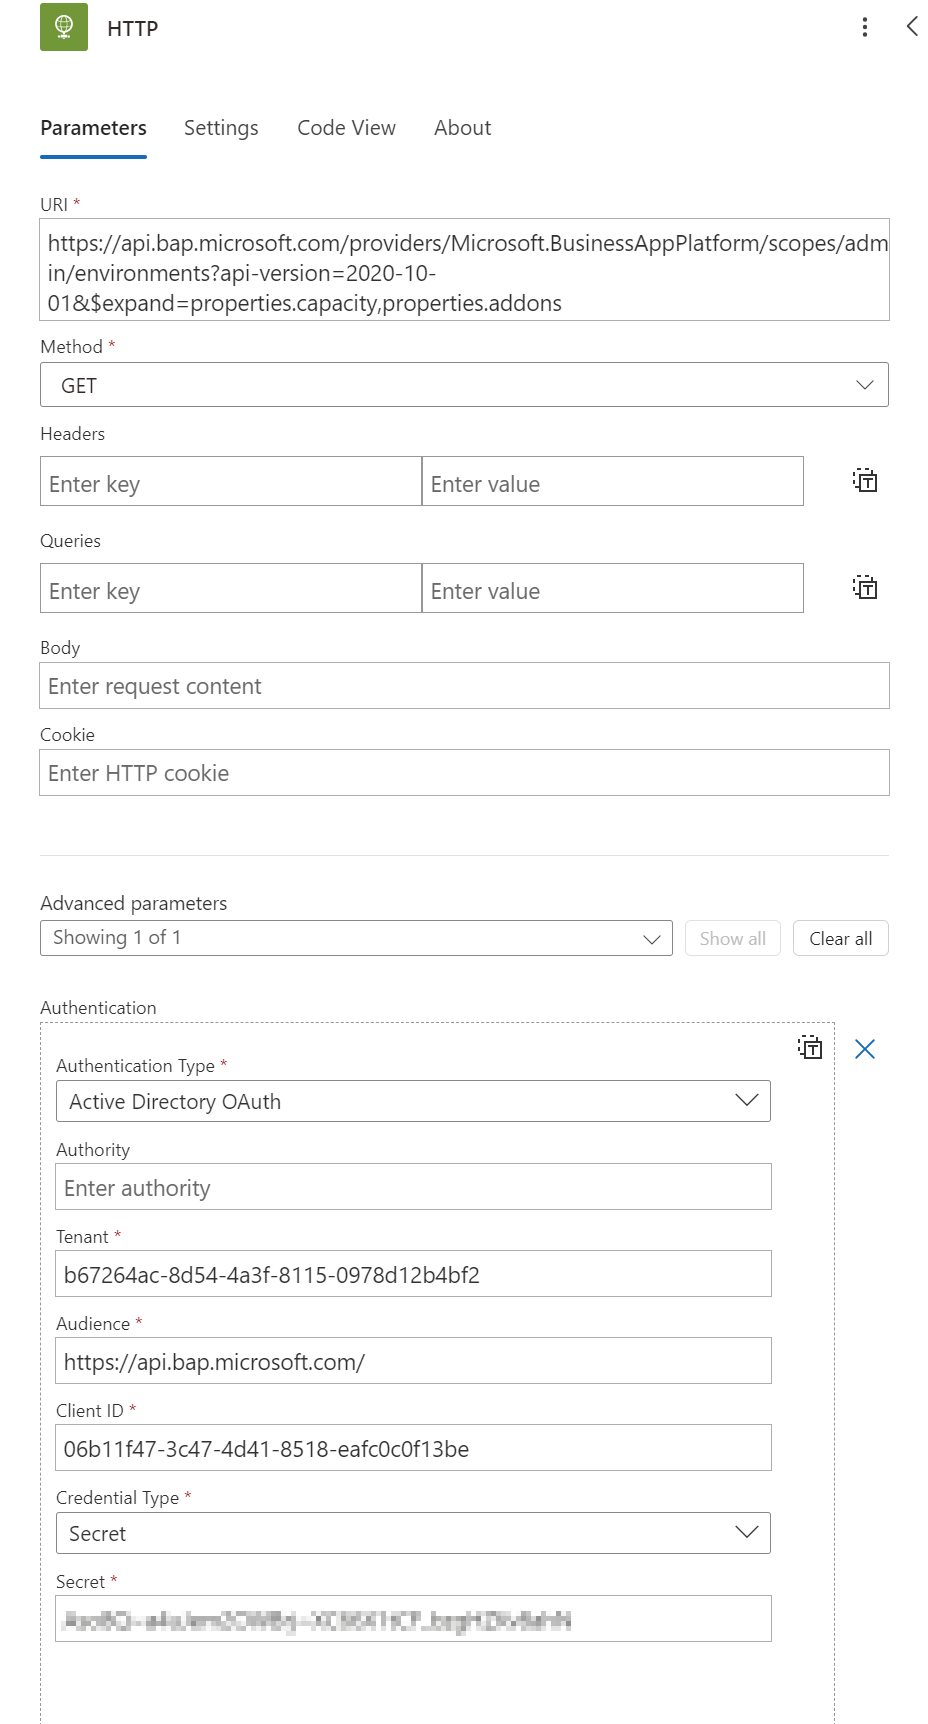
The first thing to do, after the trigger but I guess everyone knows this, is to use the Http action to get the full content we’re looking for. To do this, you’ll need to specify all the details we discussed earlier, including the endpoint, but more interestingly, the Authentication:
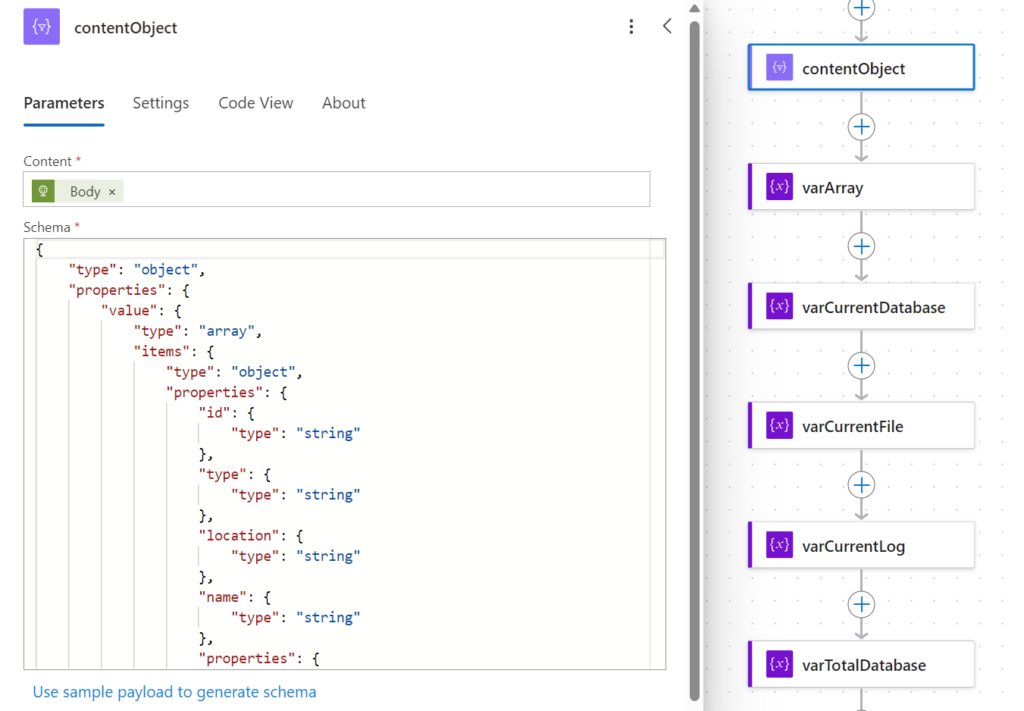
Once done, we will prepare all variables needed for our current goals as defined below (you’ll see that I like to isolate different things to ensure the readability of the information):
- contentObject: We’ll use the Parse JSON action to make sure we have a manipulatable object using the schema we’ve retrieved from PostMan.
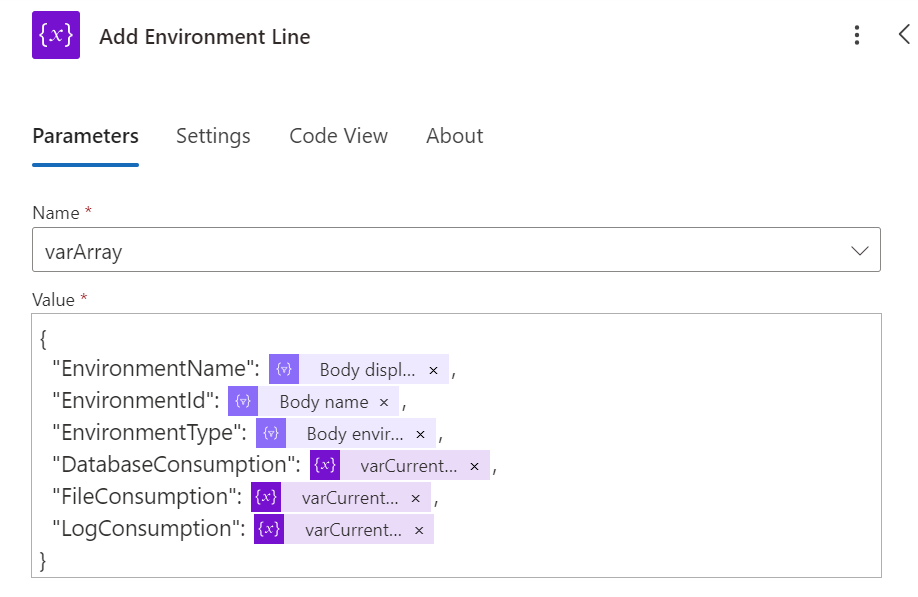
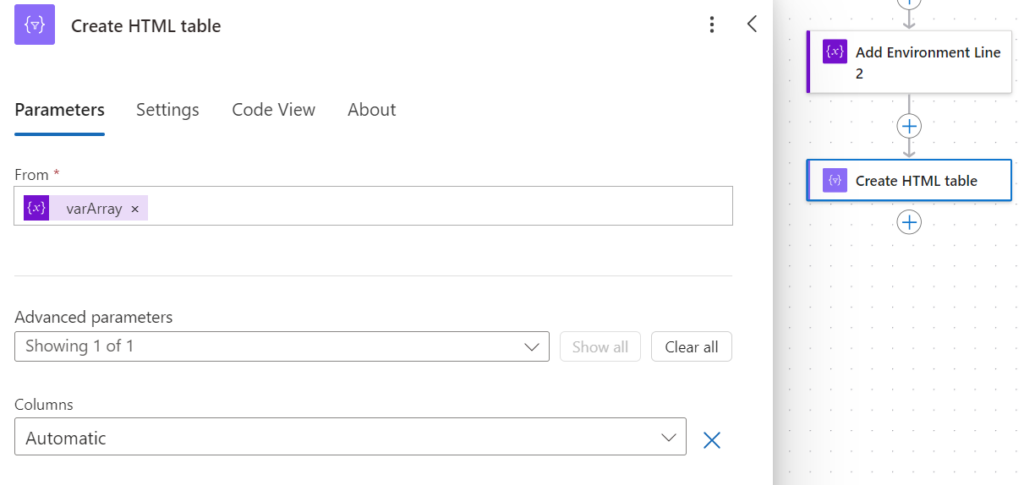
- varArray: This array will represent the list of environments (name, id and type) with details of storage consumption and a last line for the grand total.
- varCurrentDatabase: This variable will allow us, when parsing each environment, to keep the Database part in order to facilitate reading.
- varCurrentFile: This variable will allow us, when parsing each environment, to keep the File part in order to facilitate reading.
- varCurrentLog: This variable will allow us, when parsing each environment, to keep the Log part in order to facilitate reading.
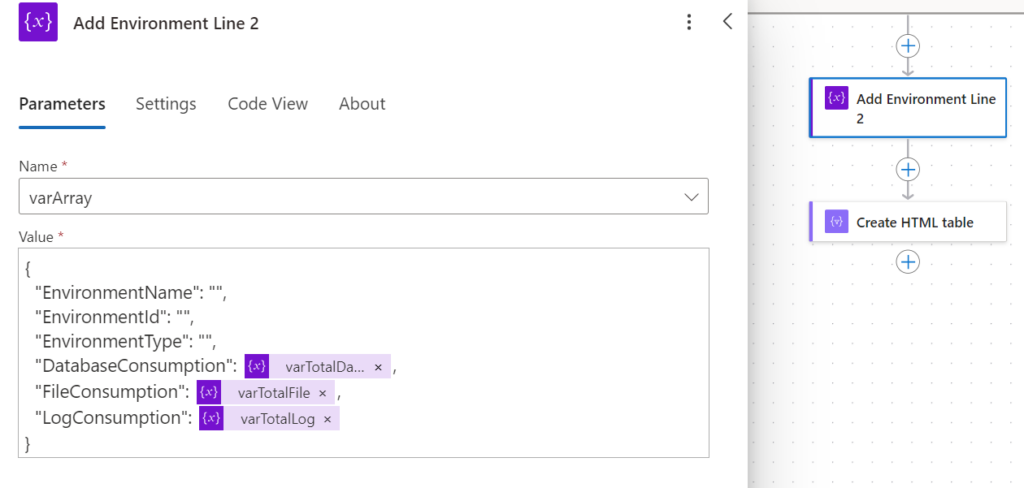
- varTotalDatabase: This variable would sum up the consumption of all environments on the Database part and display it as the sum at the end of the table.
- varTotalLog: This variable would sum up the consumption of all environments on the Log part and display it as the sum at the end of the table.
- varTotalFile: This variable would sum up the consumption of all environments on the File part and display it as the sum at the end of the table.
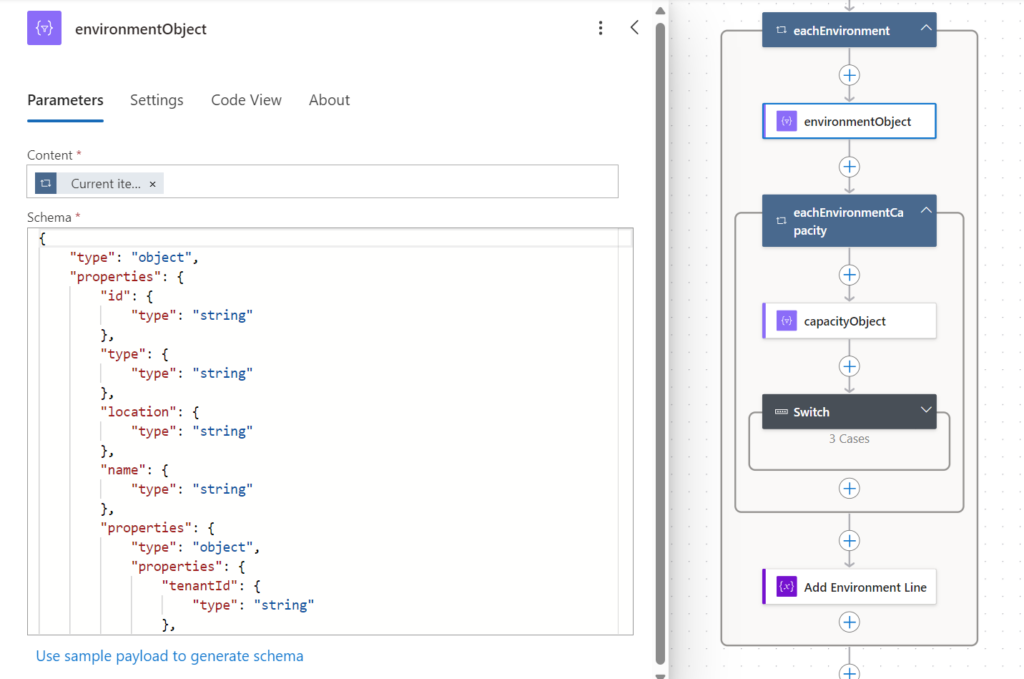
We’re now going to start processing all the environments in the content, diving into the capacity properties to update the various variables and then adding the environment consumption result (a line so) to the final table.
- So, we’ll use an Apply to each with the content of our parsing and then cleanly parse the content of the element (in this case, the definition of the environment) using the current item.
- For each environment, we’ll retrieve the list of “capacities”, which we’ll also parse into an object.
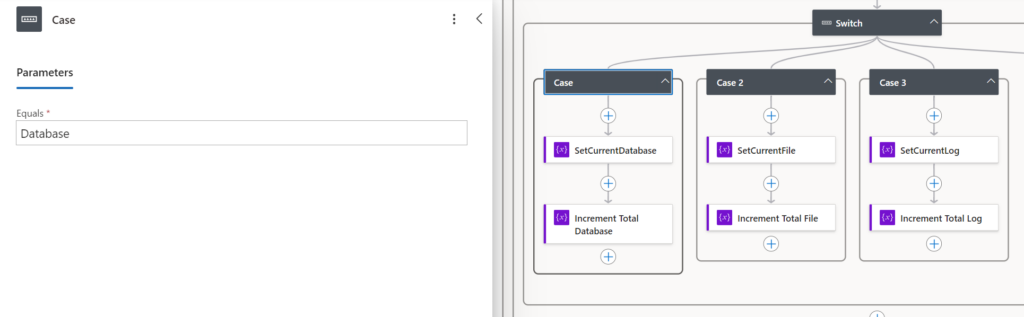
- As we have several types of capacity, we’ll use a Switch (note that we could have used expressions directly inside the variables) which, depending on the capacity, will feed the two corresponding variables (Current and Total).
- NB: you can add concurrency at this level without any problem.
- Finally, we’ll add a line to our final array representing our environment and its consumption.
If you zoom in on the switch, you should get something like this (note that I’m incrementing the total variable rather than overwriting the value, since we want the total for all environments here):
To create the array, I’ve used the following format, but you can totally improve it if you wish, for example, the url or other properties present in the response:
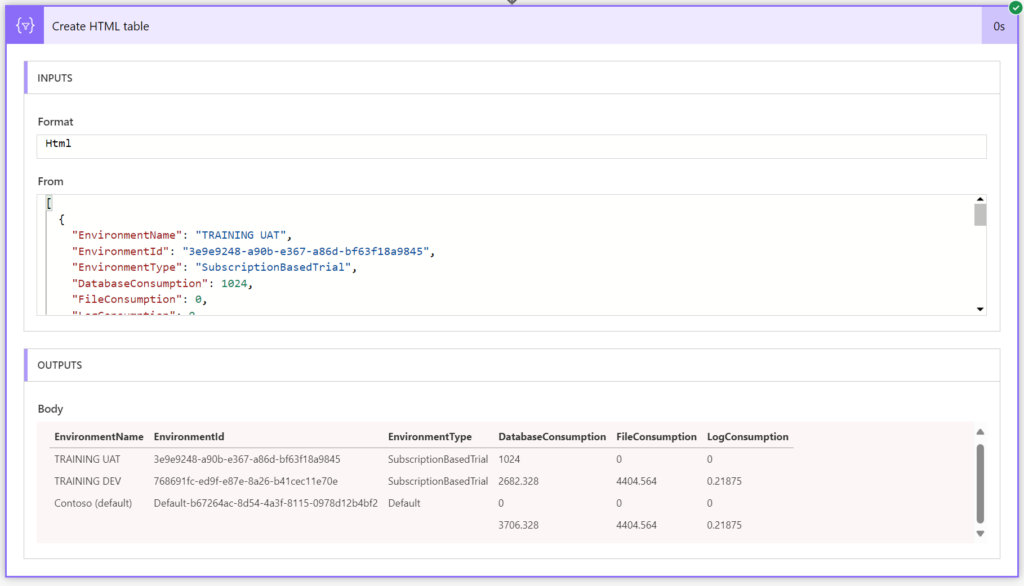
Now that the parsing of each environment is complete, all we need to do is manage a line for the total and create a table that we can send by e-mail, for example:
Once executed, you’ll get the result below (here using the old designer because it’s much easier to read 😉 ):
If you’d like to see/download the Flow directly, click here: https://github.com/allandecastro/DataverseCapacityReport

Comments (10)
Leverage the Power Platform API to create a Capacity Report | 365 Communitysays:
February 26, 2024 at 11:16 PM[…] Leverage the Power Platform API to create a Capacity Report […]
krishnasays:
April 9, 2024 at 1:01 PMHow can track the progress of the database growth for every environment
Allan De Castrosays:
April 9, 2024 at 10:44 PMHey
You can easily achieve this by using the method in this blog post and storing capacity every day, so you can calculate growth.
Regards,
Alexsays:
April 17, 2024 at 3:03 PMHello, really interesting topic !
But I have a suggestion, for this kind of topic, you should does a video to have a step by step for peaples who not masterise this subject.
That can really help (peaples like me for exemple :p )
Regards,
Allan De Castrosays:
May 1, 2024 at 3:05 PMThanks a lot Alex for your feedback !
It’s a subject I’m currently considering :p
Christophersays:
May 10, 2024 at 8:15 AMDo you thinks it’s possible to have the same kind of Flow, to have the detailled size of all tables in a in a specific environment ?
I know we can do this manually in Power Admin Center, but I would like to automatised this task.
Thanks in advance
Allan De Castrosays:
May 11, 2024 at 3:22 PMChristopher,
Unfortunately, this is not possible at the moment.
Thanks,
krishnasays:
May 16, 2024 at 8:30 AMThis is great aerticle to get the capacity for each enviornment. I’m looking to get the tenant level capapcity that includes capapcity added via license , but I’m not sure how we get the additonal capapcity (Database storage, by added capacity )?
Tsays:
January 27, 2025 at 4:39 PMIs it even required to add API Permission to the app if you add the app as a “PowerAppManagementApp” anyways? Simply giving the app “PowerAppManagementApp” without adding API Permissions seems to provide full access.
Allan De Castrosays:
May 26, 2025 at 10:44 PMHello,
Are you about that ? For it was not working (at least when I wrote this blog post).
Thanks,