If you visit my blog from time to time, you may have noticed that one of my last articles was about the possibility to analyze the log data of your Dataverse environment directly from Application Insight, and therefore you may have implemented this standard integration between your Dataverse and Application Insight environment!
However, we’re only talking about the standard Application Insights integration and analysis, but not what we can do to extend that information by sending custom traces from our server-side developments! If you still don’t understand, despite the title of the article, we’ll look at sending custom telemetry traces!
What is the difference compared to the standard integration?
Even though the idea of being able to send telemetry in an autonomous/custom way is attractive, it is still interesting to understand the difference between the OOB telemetry that this integration offers us and the possibility to extend it.
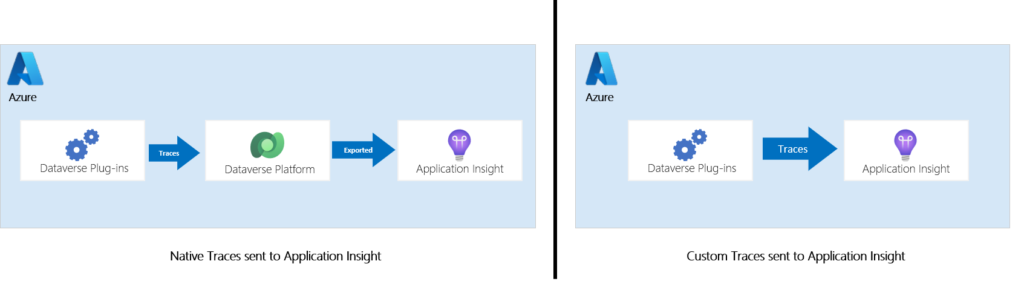
The first point is how the information is transmitted. All telemetry logs from the standard integration go through the Dataverse platform first and are then sent to Application Insights, whereas when you write your own telemetry, it is sent directly. This intermediate step of standard telemetry is not present, so you will see this data arrive faster in your Azure service and not be stored intermediately by Microsoft.
Another aspect is that since we are technically sending traces at our convenience, we are going to use a library to interface with our backend (here Application Insights) from our plug-ins. This library is quite familiar, especially if you’ve ever designed pure .Net applications or used/implemented Azure Functions/Web App (by default this library is used).
As you may have understood, we are talking about the ILogger interface which is usually provided by the NuGet Microsoft.Extensions.Logging.Abstractions package. In our case, we will use a package dedicated to our dear Dataverse: Microsoft.Xrm.Sdk.PluginTelemetry! So, let’s start looking at this package 🙂
Why implementing custom telemetry?
Just because you can add custom traces to this integration doesn’t necessarily mean you should, but you should know why!
From my point of view, several use cases can be addressed with the implementation of these custom traces.
- When enabling native integration with Application Insights, you may have noticed that many traces were sent in a platform-specific format. When you want to formalize the traces in a certain way using a common model for your company or already used by other components, it makes sense to add your own traces with the custom dimensions we are interested in.
- They also allow us to obtain a granularity of information and performance times that can be at the level of a particular function or block of code. This is very interesting when we want to monitor processes considered critical to the company and see their evolution over time.
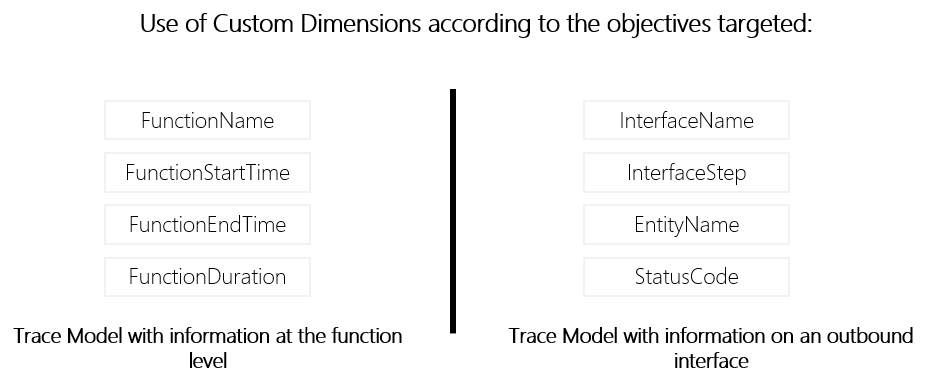
Note that I have already implemented this type of model to follow an interface from end to end, i.e. from the plug-ins and through the Azure integration layer and I must say that it is quite convincing and interesting to follow the execution of an interface from the trigger to the processed message including the transformation and eventual API call.
- If you are an ISV and you offer a complete solution, via App Source for example, and your solution includes plug-ins, it will be easier for you to help your customers if you have dedicated traces of your assembly execution. This will help guide them towards resolution, but also allow them to understand what is going on and provide you with additional information in case the resolution is not obvious.
However, this does not mean that the use of ITracingService should be replaced! Firstly because not everyone will activate this feature and especially when a customer does not (yet) use Azure or use another private cloud, but also because the purpose of the traces to Application Insight have another goal than the ITracingService. The latter is intended to be used during the development phase and also during debugging, whereas Application Insights is more focused on monitoring for analysis purposes, including potentially incident resolution. Moreover, by default the retention of Application Insight is 90 days while the internal traces are only 24 hours and if you use like me a plug-in base with an overlay to give a set of information in the traces, you can sometimes find that they are truncated if you exceed a 10Kb limit.
How to write custom telemetry?
Microsoft.Xrm.Sdk.PluginTelemetry namespace
The first thing to consider is that this is a new feature that was part of the 2021 wave 1 !
This namespace is composed of three elements, a class to identify a particular telemetry event, the ILogger interface and finally an enums defining the severity of the trace.
All severity levels have a method from the ILogger interface to directly write a log with the specified severity, but there are also four interesting methods for us coming from this interface:
- IsEnabled: Checks if the given LogLevel is activated. For me, it can be used for two use cases:
- When the computation of some past arguments can be expensive. The caller can therefore filter the work as needed with an if statement IsEnabled(LogLevel.Debug).
- Some of you have already used the ITracingService and depending on the version of your .Net assembly you can use a region with the DEBUG keyword (#if DEBUG) to make sure that this block of code must be executed or not depending on the version of the generated assembly. Well, it’s the same principle here, which allows you to put more details, such as PII or other sensitive data, in debug messages that would not be displayed in production!
- AddCustomProperty: I was very interested in this one because if you understood the chapter above, it would be nice to be able to add Customs Dimensions to get the information we want, but you could also see that it is “For internal use only” and even though I tried to use it, it didn’t work on my end :/ . Hopefully this will be available in the future as well as other Azure services using the logging nugget extension. It also seems that the Object parameter of the various Log methods is not usable or does not work. So the question that remains is how to send custom properties ? 🙂
- BeginScope: Scopes are useful for transparently adding Custom Properties to all logs in a given execution context. The goal is to use it for particular logical contexts, blocks of code or transactions, e.g. an outbound HTTP call, a complete functional process involving several transactions, etc. As you can guess, this is what we are interested in sending our traces. The only drawback is that we can’t send a trace with different custom dimensions because we can’t use the AddCustomProperty, so we will have to “play” with the scopes for that.
Add telemetry traces from your plug-ins
To start with and to unify the properties and avoid human errors, I prefer to create a class containing the keys/values of the custom properties that will be added. This also makes it easy to change the value in one place 🙂 :
    public static class TelemetryProperties
    {
        public const string INTERFACE_NAME = "InterfaceName";
        public const string CORRELATION_ID = "CorrelationId";
        public const string ENTITY_NAME = "EntityName";
        public const string OPERATION_NAME = "OperationName";
        public const string RECORD_ID = "RecordId";
        public const string INTERFACE_STEP = "InterfaceStep";
    }
Finally, I decided to add a dedicated service class to make it easier to initiate the ILogger within the plug-in base but also when we want to access the service and log traces.
    public class TelemetryService
    {
        private ILogger _logger;
        public TelemetryService(ILogger Logger)
        {
            _logger=Logger;
        }

        public void TrackTraceInterfaceTrigger(string interfaceName, string interfaceStep, Entity record,string correlationId, string operationName)
        {
            using (_logger.BeginScope(new Dictionary
            {
                [TelemetryProperties.INTERFACE_NAME] = interfaceName,
                [TelemetryProperties.INTERFACE_STEP] = interfaceStep,
                [TelemetryProperties.ENTITY_NAME] = record.LogicalName,
                [TelemetryProperties.RECORD_ID] = record.Id,
                [TelemetryProperties.CORRELATION_ID] = correlationId,
                [TelemetryProperties.OPERATION_NAME] = operationName
            }))
            {
                _logger.LogInformation(GetTelemetryMessage(interfaceStep));
            }
        }
    }
You can see that I implemented a dedicated function that here only log information (we could have an additional overlay to handle other cases while keeping the same properties) with a set of parameters to fill in the customs properties that will be apparent to the trace in the scope.
In my case, the objective was to be able to trace the execution of a plug-in used as a trigger for an interface by indicating the name of the interface, the step of the interface (which allows having a step of starting, error, retry, success etc.), the name of the table, the unique identifier of the record, the operation (it is not necessarily only CRUD because we are talking here about an operation in terms of functional interface, so it can also be a merge action or a scoring calculation, etc.) and finally, something very important, the CorrelationId corresponding to the PluginCorrelationId.
So here’s how I can use a simple instruction in the right place to trace the information I’m interested in:
 localContext.Telemetry.TrackTraceInterfaceTrigger("XXX_YYY_ZZZ","STARTED",targetEntity,localContext.PluginExecutionContext.CorrelationId.ToString(),"CREATE");
localContext.Telemetry.TrackTraceInterfaceTrigger("XXX_YYY_ZZZ","RETRYING",targetEntity,localContext.PluginExecutionContext.CorrelationId.ToString(),"CREATE");
localContext.Telemetry.TrackTraceInterfaceTrigger("XXX_YYY_ZZZ","ERROR",targetEntity,localContext.PluginExecutionContext.CorrelationId.ToString(),"CREATE");
localContext.Telemetry.TrackTraceInterfaceTrigger("XXX_YYY_ZZZ","SUCCESS",targetEntity,localContext.PluginExecutionContext.CorrelationId.ToString(),"CREATE");
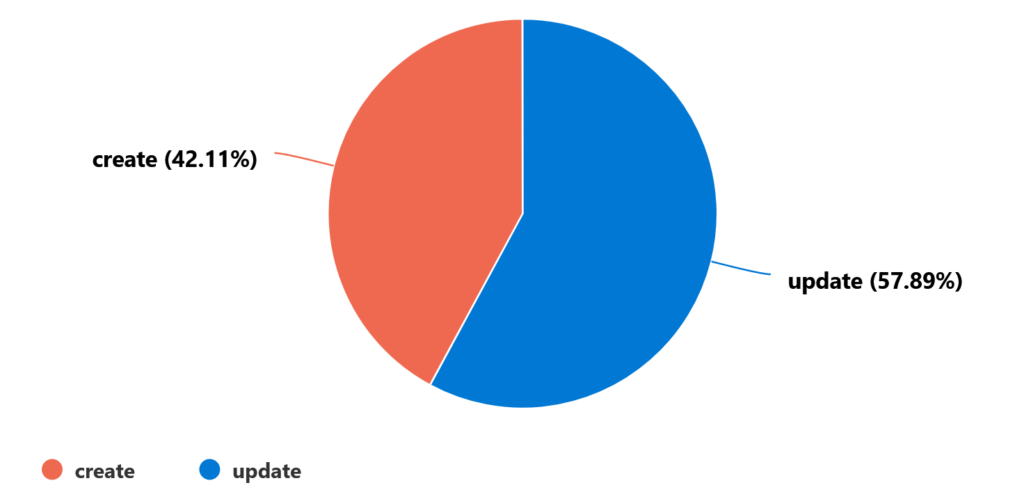
Finally, we just have to create a query to display the information we want, for example below the number of errors per operation:

Comments (7)
Faride ILANDAsays:
November 4, 2022 at 7:02 PMHello Allan,
Thanks for sharing !
How about GetTelemetryMessage function ?
Allan De Castrosays:
November 5, 2022 at 8:37 PMHello Faride,
Thanks for your interest 🙂
GetTelemetryMessage is not an important function, it is just used to get a “functional” label according to the parameter. One could also simply send the content of the trace via a dedicated argument.
Regards,
Faride Ilandasays:
November 8, 2022 at 12:03 PMThanks Allan.
Jani Skuljsays:
January 5, 2023 at 3:38 PMThanks for great content.
Did you maybe also had a chance to look into custom logging from browser (client scripts)? I imagine there should be a method for custom logging in Xrm namespace.
Allan De Castrosays:
January 8, 2023 at 10:00 PMHello Jani,
Unfortunately, there is no out-of-the-box integration on the client side.
But you can use a library like this one : https://github.com/vgrade/MSCRM/blob/main/Scripts/ClientSideAppInsightsLog.js
Regards,
Sunnysays:
November 25, 2023 at 3:04 PMIs there any reference for custom workflow activity logging with App insight?
Allan De Castrosays:
January 3, 2024 at 10:54 PMHello Sunny,
You can use the same concept for sure using the ILogger service!
Thanks,